
For more information about Effects in general, please see the Effects Rack Overview section.
Audio Tools
Spectra-lyser (Mono/Stereo)
The standard Spectra-lyser view provides a fixed-point-per-octave spectrum analyser, providing high resolution analysis even at low frequencies. The Gain control allows a level offset to be added to the incoming signal to optimise the level for display. A Play/Pause button allows the graph view to be paused for further analysis.
Note: The Gain control only affects the signal sent to the analyser; the signal routed to the output of the module remains at unity gain. The module can therefore be inserted transparently into paths (e.g. output bus) for feedback monitoring and other spectrum analysis applications.
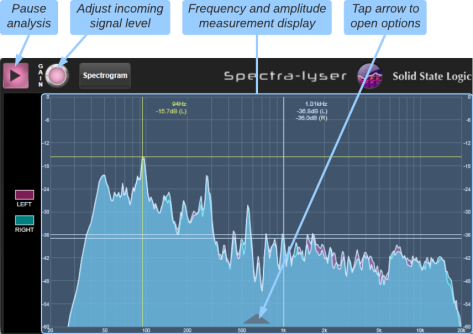
Tap the arrow at the bottom of the graph area to view display options for the analyser:
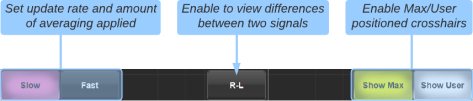
The Slow and Fast buttons determine the update rate and amount of averaging applied to the signal for displaying on the analyser.
The R-L button is only available in the stereo version of the module and shows the difference between Left and Right channels. These can be routed from two separate signals for comparison.
Use the Show Max button to display a set of crosshairs at the maximum amplitude detected.
Use the Show User button to display a set of crosshairs at a user defined frequency. Tap the graph or use the encoder beneath the screen (in Follow Detail Mode) to set the frequency.
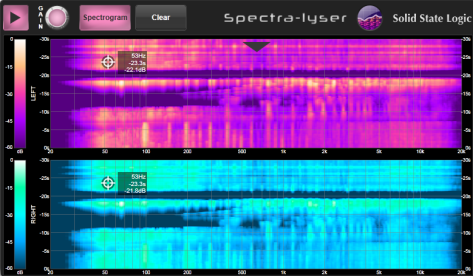
Spectrogram mode provides a graph of frequency content over time, displayed as a heat map. The same averaging (Slow/Fast), user crosshairs and difference (R-L) modes are also available in Spectrogram view. Tap the arrow at the top of the graph to view them. The graph update style can also be set from here to one of two modes: Wipe or Scroll. In Wipe mode new values are displayed moving down the display, wrapping from one end of the graph to the other. In Scroll mode, new values are displayed at the bottom of the graph, with historical values displayed moving up the graph. A Clear button clears the display.
The main screen, Control Tile screen (if fitted), SOLSA and TaCo displays have independent view options, allowing each screen to show either analyser or spectrogram views.
Note: This module replaces the FPPO-lyser (fixed-point-per-octave analyser). All instances of the FPPO-lyser in showfiles will appear as the new Spectra-lyser module and all previously saved settings will be compatible and retained.
Function Generator (Mono)
The Function generator provides an oscillator of variable frequency, with a fixed option of 1 kHz, in addition to white noise and pink noise generation:
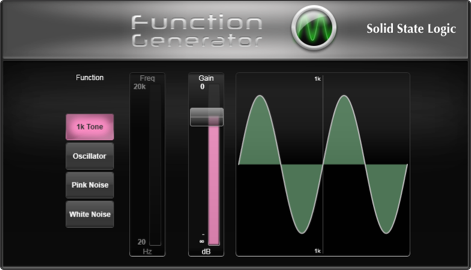
Use the Gain control to adjust the signal level. The Freq control is only available in Oscillator mode.
Signal Detector (Mono)
The Signal Detector module is used to trigger Signal Switcher input changes.
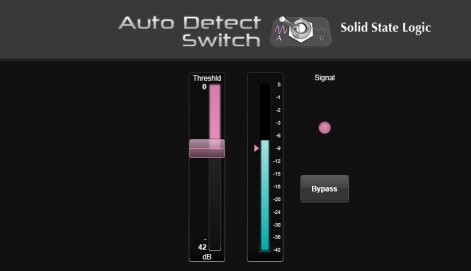
The meter shows the level of the incoming signal to the module. It is advised that a dedicated control signal with fixed amplitude be used from the primary audio source.
Use the Threshold control to set the threshold level just below the incoming signal level. When the signal drops below the threshold the Signal Switcher will switch to Input B.
The Bypass button can be used to suspend the control signal from the detector module to the Signal Switcher, allowing setup of the detector without triggering an input change on the switcher.
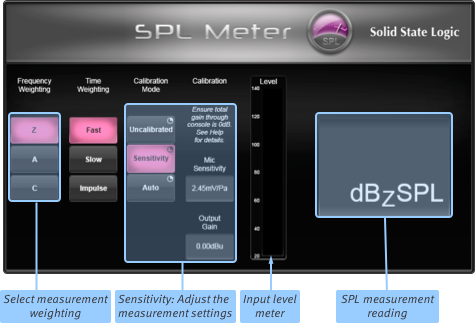
SPL Meter (Mono)
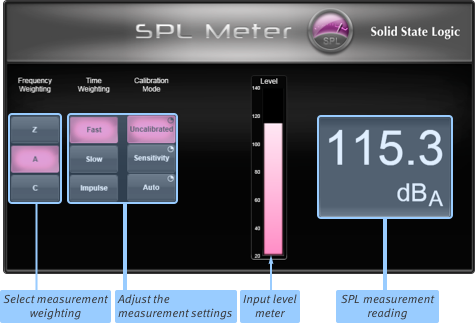
Use the Frequency Weighting buttons to choose the weighting:
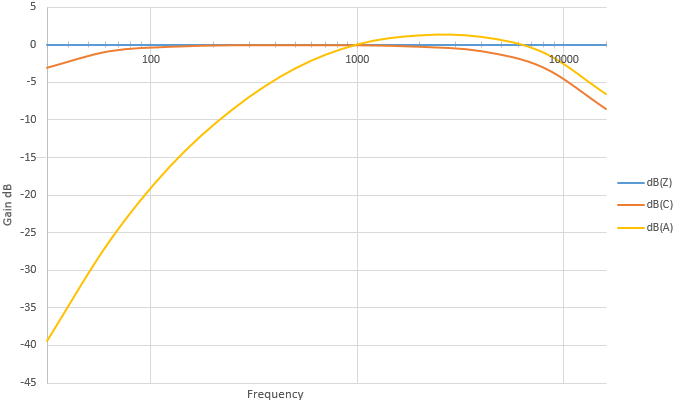
- Z : dB(Z) - Flat frequency response (unweighted): 10 Hz to 20 kHz ±1.5 dB
- A : dB(A) - Most common, shaped to model the response of the human auditory system below 100 dB SPL (based on equal loudness curves)
- C : dB(C) - Commonly used for Peak SPL measurement. Flatter than dB(A), to mimic the human ear response above 100 dB
Use the Time Weighting buttons to choose the attack time constant:
- Fast : 125 ms
- Slow : 1000 ms
- Impulse : 35 ms
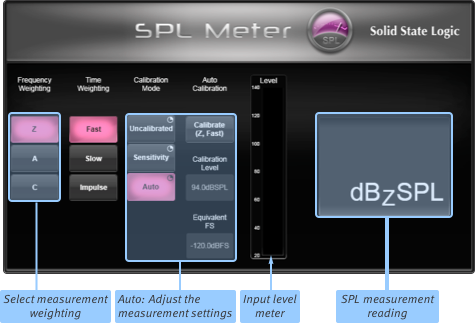
Calibration Mode
The SPL Meter has three Calibration Modes. Each has a varying level of complexity to configure and is proportional to its accuracy.
In Uncalibrated mode the meter will read 140 dB at 0 dBFS. This is the least accurate mode.
Auto mode uses a simple calibration routine to equate a known dB SPL level to a measured dB FS level. Connect a known dB SPL source to the console and route it to an Input Channel. Insert the SPL Meter into the Channel's Insert point and set the Calibration Mode to Auto. Press the Calibrate (Z, Fast) button. This will automatically set the meter's frequency and time weighting to dB(Z) and Fast respectively. Next, enter the known dB SPL level into the Calibration Level field. Once the Equivalent FS level has settled, press the Calibrate (Z, Fast) button again. Do not change the Calibration Mode as this will reset the calibration.
 Sensitivity mode requires information about the measurement microphone being used, specifically its sensitivity in mV/Pa.
This can usually be found in the specifications section of your microphone's manual or web page.
Sensitivity mode requires information about the measurement microphone being used, specifically its sensitivity in mV/Pa.
This can usually be found in the specifications section of your microphone's manual or web page.
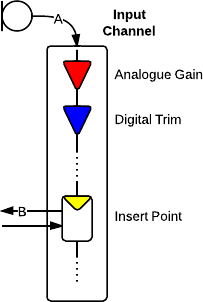
Route the measurement microphone to an Input Channel and route the Channel's Insert send to a console output. Set the Input Channel's Analogue Gain to a nominal value so that the input is not clipping and set the Digital Trim to 0 dB.
Send an input signal of known level (A) into the channel and adjust the console's output trim (in the I/O Setup page) until the output level (B) matches the known input level (you may need to adjust the input gain to achieve this).
Do not adjust the gain structure between the input and Insert point from now on as this will invalidate the calibration procedure.
Unroute the console output from the Channel's Insert point and insert the SPL Meter in its place. Set the Calibration Mode to Sensitivity and enter the microphone's sensitivity into the Mic Sensitivity field.
Finally, add the console's operating level (found in MENU > Setup > System / Power > System tab) to the output trim offset that was applied to match the input and output levels and enter it into the Output Gain field of the SPL Meter module.
Revert the output trim to your operational requirements and ensure that the gain structure between mic and SPL Meter remains constant (e.g. you may wish to exclude this channel from automation recall scope).
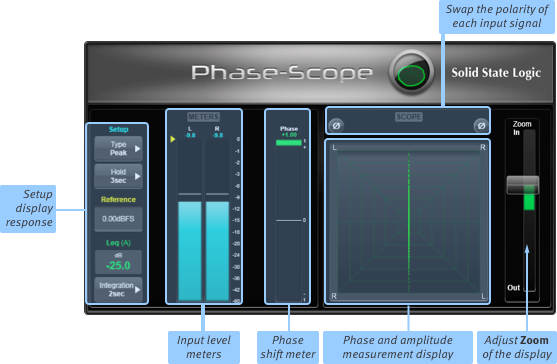
Phase-Scope (Stereo/LCR)
Stereo
LCR
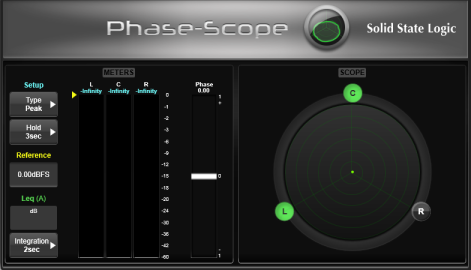
The stereo and LCR Phase Scope modules allow the phase of two or three sources to be compared in real-time.
Type: Set Peak or RMS sensing.
Hold: Set the detector hold time to 3seconds, 10seconds, Infinite or None. There is also an option to RESET the hold indicator.
Reference: Set the reference measurement level.
Integration: Set integration time to 1seconds, 2seconds, 10seconds, 30seconds, 1minute, 2minutes or Infinite. There is also an option to RESET the integration time.
Monitoring Modules (Stereo/4.0/5.1)
The Monitoring modules are designed to be inserted into Solo Channels or other output channels to provide monitor source compatibility and confidence checking.
The Stereo Monitoring Module provides all the expected compatibility monitoring modes needed for stereo production.
- A Mono monitor feed can be sourced from the sum of the Stereo inputs or independently from the left or right inputs and the selected mono source can be routed to both monitor outputs or just to a single speaker by using the L, R and L+R buttons in the Mono From and Mono Tools sections. Automatic gain compensation maintains a consistent monitor level regardless of the mono source and destination selection.
- A left channel 180° polarity inversion (via the ØL button) provides stereo phase verification. As this is upstream of the Mono monitor summing, if activated in conjunction with the mono option, the stereo difference or 'S' signal is routed to the monitor outputs instead of the stereo sum.
- The LR Reverse button helps identify whether there is an anomaly in the incoming source or an issue in the monitoring chain.
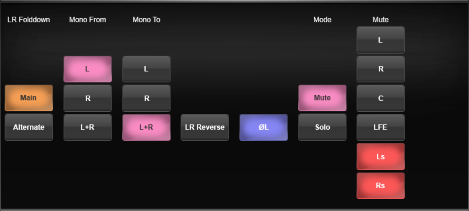
The Multi Format Monitoring Module is a 4.0 or 5.1 Module that includes all the features of the Stereo Monitoring Module but with the additional elements that surround monitoring requires.
- 5.1 to LR Folddown with a choice of the user configurable Main (Default) or Alternate folddown coefficients that are set in the System Options menu (MENU > Setup > Options > System tab).
- Individual Speaker Mute buttons which can be reassigned as Speaker Solo keys.
- Bass Management page for configuring enhanced low frequency monitoring in less than optimal monitor environments. The redirect frequency can be set anywhere 40 to 120 Hz and the high pass and low pass filters are independently switchable between 2nd, 3rd and 4th order filter slopes. The summed main monitor redirect signal sent to the Sub output can be trimmed by ± 10 dB.
Note: As the Solo Channels include EQ, delay and All Pass filters, and with the option of an FX Rack graphic EQ in the other insert point, it's possible to fine tune a surround monitor setup without resorting to outboard processing or other external speaker management hardware.
Transfer Function Analyser
The Transfer Function Analyser is an acoustical measurement tool for the SSL Live Effects Rack.
The Transfer Function Analyser is an analyser that shows the fixed-point per octave transfer function (TF) and the impulse response (IR) of a (linear time-invariant) system. This can be used to measure any system from a loudspeaker to an audio processor, although the primary purpose for the Transfer Function Analyser is for measuring acoustic spaces.
The Transfer Function Analyser can be found in the Tools folder and is available in Stereo, LCR, 4.0, 5.1, 4-Wide, 8-Wide and 12-Wide formats.
First, route the inputs to the Transfer Function Analyser in the same way as with other Effects units. Then tap the Input Select button. This opens a pop out menu. Tap in the appropriate crosspoint to choose the Reference and Measurement sources. Tap on the Input Select button again to close the pop out. By default the Reference source is set to Input 1 and the Measurement source is set to Input 2.
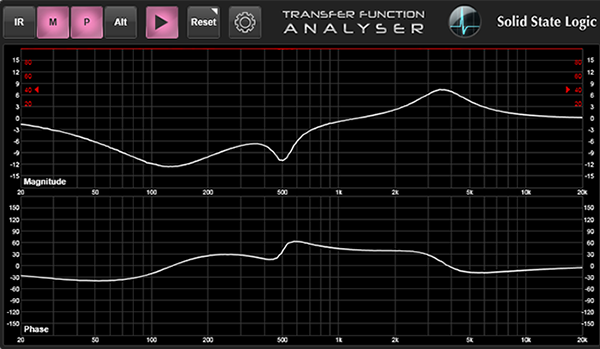
The Transfer Function Analyser can display Transfer Functions Magnitude, Phase and Coherence as well as Impulse Response. To select the measurement to display, tap on the buttons in the top left corner. Engage IR for Impulse Response, M for Magnitude and P for Phase.
Coherence is displayed as a red line at the top of the Magnitude graph. If only the Phase graph is displayed, Coherence will be displayed at the top of the Phase graph. Coherence threshold is displayed to the right of the screen with an arrow to indicate the Coherence threshold.
These buttons can be engaged or disengaged as required. When only one measurement is selected, one larger graph will be displayed. When two measurements are engaged, two smaller graphs are displayed. Engaging a third measurement will disengage the first one selected so that only two measurements (as well as Coherence) can be displayed at one time.
There are two views that can be configured, saving time when alternating between different measurement graphs. Engaging the measurement display buttons adds those graphs to the Main view. Engaging the Alt button switches to the Alternative view. Engaging the measurement display buttons here adds those graphs to the Alternative view. Disengaging the Alt button switches back to the Main view. The graphs are labelled in the bottom left corner.
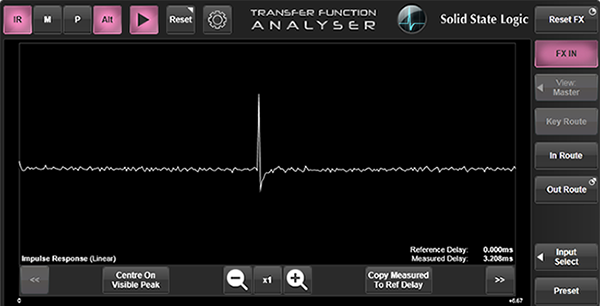
The Impulse Response graph is displayed with the IR Display mode, the Reference Delay and the Measured Delay (see below). Navigation controls can be brought up by tapping on the up arrow at the bottom of the Impulse Response graph. There are Zoom In and Zoom Out buttons to zoom the graph area around the detected peak, as well as a x1 button to return to default zoom. The Left and Right arrows allow scrolling along the x axis (when zoomed in). The Centre on Visible Peak button will centre the graph area on the peak detected within the visible graph area. Copy Measured to Ref Delay copies the Measured delay to the Reference delay. This button has the same function as the Copy to Ref Delay button in the settings menu (see below). After a few moments of inactivity, this pop up will close automatically.
To reset the IR or TF measurement, press the Reset button at the top. Now select IR or TF.
Settings
Tap on the cog symbol to open the settings menu.

Impulse Response Settings
| Measured Delay | The delay of the system being tested. This is automatically detected and displayed here. |
|---|---|
| Copy to Ref Delay button | Copies the Measured Delay (displayed to the left) to the Reference Delay field. |
| Num Averages | The number of consecutive FFTs over which to average the IR. |
| FFT Length | Determines the length of the IR estimate and therefore the maximum system delay that it can detect. e.g. 256k at 96 kHz sample rate gives a 2.67 seconds IR length. |
| IR Display |
Linear displays the ray IR and preserves the positive and negative values (which can be useful for determining system polarity). Log displays the log of the magnitude of the raw IR. ETC stands for Energy Time Curve, which is an envelope of the Log display. It can be easier to identify the peaks using this display. |
Transfer Function Settings
| Ref Delay | The amount by which the reference signal is delayed. This should be set to the delay through the system that is being tested. The IR can be used to automatically detect this. |
|---|---|
| Num Averages | The number of consecutive FFTs over which to average the TF |
| Averaging Mode |
Change the Averaging Mode for Magnitude only. Magnitude Averaging Mode takes a geometric mean of the magnitude values. This mode can perform better in windy conditions when the measurement signal has a variable arrival time. Magnitude & Phase Averaging Mode preserves phase information and is more suited to removing noise. |
| Ref Threshold | The threshold at which the graph updates. Reference signal below this threshold will not update the graph and the graph will appear frozen. |
Useful Links
Detail ViewEffects Rack Overview
Delay Effects
Dynamics Effects
EQ Effects
Modulation Effects
Reverb Effects
Other Effects Modules
Automix
Index and Glossary
